0.4 — PORTFOLIO

Selected projects.

Each of these started as a real question. Pay equity, resale pricing, privacy risk, how a pandemic moved across states. The work was building the data infrastructure and analysis to actually answer it, end to end. Almost all of them run on Python and SQL, from relational schema design and query optimization on one side to pandas and scikit-learn modeling on the other.

Python SQL scikit-learn pandas Tableau Azure SQL Database Design NLP
01
Systems Design · DB

Equality-Driven HRIS

PAY-EQUITY HRIS

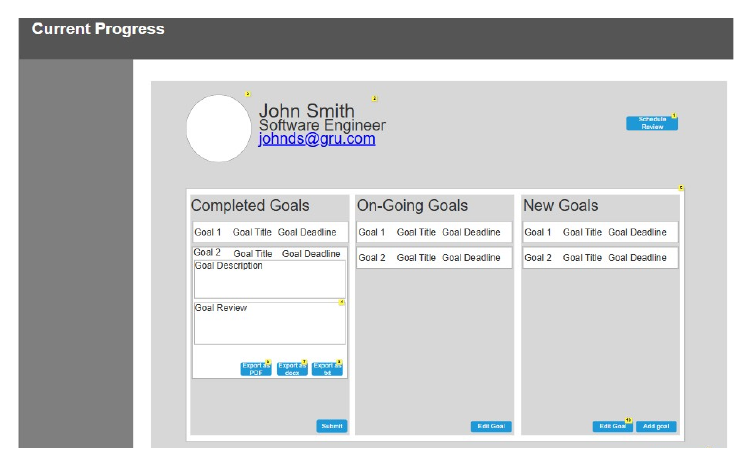
A redesign of a global retailer's Human Resources Information System (4,000+ stores) built around a single goal: detect and close gender- and race-based pay disparities. I designed the equitable-pay data model and the manager-facing performance and compensation dashboards, with role-based access control, audit logging, and compensation-review workflows baked in.

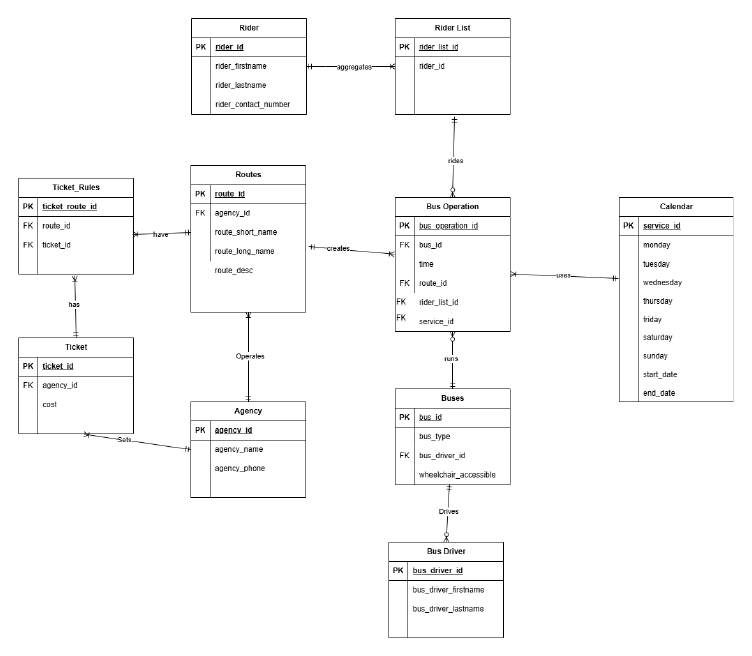
On top of the systems-design work I built the analytical layer: a SQL schema for employees, compensation history, and audit trails, and a Python pay-gap analysis (regression controlling for role, level, and tenure) that feeds the disparity flags surfaced on the dashboard.

Tools & skills

PythonSQLpandasstatsmodelsRBACAudit LoggingDashboard Design

What I learned

  • Fairness has to be something you can query. A pay-equity claim is only as good as the schema and the controls sitting behind the number.
  • Audit trails and role-based access aren't features you bolt on at the end. They shape the data model from the very first table.
  • A dashboard only changes behavior when the metric behind it can stand up to legal and HR at the same time.
FIG · COMPENSATION DASHBOARD WIREFRAME
HRIS current-progress dashboard wireframe showing completed, on-going, and new goals
02
FIG · AVG RESALE PRICE BY BRAND × CONDITION
Tableau bar chart of average Grailed resale price by brand and condition
Open live dashboard
Analytics · Viz

Grailed Luxury Market Analysis

RESALE MARKET DASHBOARD

A data story on the Grailed resale market, built from thousands of menswear listings (Rick Owens, Saint Laurent, Kapital, Levi's and others). I built multi-view and interactive Tableau dashboards to answer how resale value is driven by brand prestige, item condition, Japanese-made origin, and price-drop behavior, and found a heavily right-skewed market where prestige and newness dominate.

Before any chart, the raw scrape needed serious shaping. Alongside Tableau Prep I used Python (pandas) to normalize collaboration brand strings, extract numeric waist sizes from category text, and engineer the Japan/non-Japan, price-drop, and premium-price flags, then validated the cleaned extract with SQL aggregation queries (median price by brand × condition).

Tools & skills

PythonSQLpandasTableauTableau PrepFeature Engineering

What I learned

  • Most of the signal lived in the prep work. The derived fields (origin, premium, price-drop) carried the whole story.
  • Right-skewed markets punish the mean, so the brand × condition medians told a far truer story of resale value.
  • An interactive filter is only as honest as the aggregation under it, which is why I cross-checked Tableau against my own SQL.
03
Data Science · Web

Digital i-D

INTERACTIVE PRIVACY STUDY

A web app that makes invisible data collection and dark patterns visible, then teaches people concrete habits to protect their privacy. I owned the data-science end to end: designing the survey and poll instruments on student privacy awareness, then turning responses into the awareness metrics and segment findings that drove the app's content.

I analyzed responses in Python (pandas), scoring awareness, segmenting by major and year, and testing which interventions correlated with safer behavior, then stored and queried the survey data in SQL so findings stayed reproducible as responses came in.

Tools & skills

PythonSQLpandasSurvey DesignData VizPrivacy

What I learned

  • Awareness is measurable, but only if you design the instrument and the schema before you collect a single response.
  • The gap between privacy concern and privacy action is the real opportunity here, and it's a data question first.
  • Shipping analysis into a live tool forces a discipline that a static report never does.
LIVE · DIGITAL-ID-F1AFF.WEB.APP
DI-D · DIGITAL IDENTITY
SYSTEM INITIALISED · TRACKING ACTIVE
Trace Your
Digital Footprint
 SESSION_REPLAY.log 8 events
00:00:25 (INIT)  Session replay initialized…
00:00:28 (MOUSE)  cursor at (1398, 103)
00:00:48 (LOAD)  Page fully loaded
00:00:90 (TRACK)  Mouse tracking enabled
00:02:80 (SCROLL)  scroll offset 4px
00:04:00 (SCROLL)  scroll offset 850px
00:05:23 (SCROLL)  scroll offset 1124px
00:06:39 (MOUSE)  cursor at (689, 132)
Open live app
04
NLP · Machine Learning

Privacy-Aware Fashion Review Risk Detector

NLP CLASSIFIER

A system that flags fashion reviews likely to overshare sensitive personal information (body measurements, health, pregnancy) before they're posted publicly, prompting the writer to reconsider. Built on the Women's Clothing E-Commerce Reviews dataset (23,486 reviews), with a synthetic privacy_risk target engineered during preprocessing.

The core is a Python NLP pipeline: TF-IDF features over the review text plus light metadata, a logistic-regression classifier, and tuning aimed deliberately at recall on the risk class, so it catches genuine disclosures without burying users in false warnings.

Tools & skills

Pythonscikit-learnNLPpandasTF-IDF

What I learned

  • The hard part of a safety classifier is the cost asymmetry. A missed disclosure and a false alarm are not the same size of mistake.
  • Synthetic labeling is a modeling decision wearing a disguise. How you define privacy_risk ends up defining the whole system.
  • Privacy tooling has to inform rather than censor. The model's job is to give the user a choice, not take one away.
05
Machine Learning

Fashion Subscription Return Risk Predictor

FIT PREDICTION

A decision-support model for a subscription clothing service that estimates, before a box ships, whether each item will be kept or returned. Built on the Rent-the-Runway fit dataset (~82,790 transactions, 47,958 customers, 1,378 items), with the kept_item target derived from fit feedback. The goal: cut return rates and shipping cost without collapsing into safe, boring recommendations.

I modeled it in Python using customer measurements, sizes, and product attributes as features, and used SQL joins across the customer, product, and transaction tables to assemble the training set and engineer per-customer fit history.

Tools & skills

PythonSQLscikit-learnpandasFeature Engineering

What I learned

  • "Fit" is a relationship, not a property. The features that mattered compared a body to a garment, not either one on its own.
  • Optimizing purely for low returns quietly kills variety, so the real objective is multi-sided.
  • The joins are where the modeling actually happened. Most of the signal came from assembling each customer's history.
06
MODEL · LOGREG vs RANDOM FOREST
from sklearn.feature_extraction.text import CountVectorizer
from sklearn.linear_model import LogisticRegression
from sklearn.ensemble import RandomForestClassifier

vec = CountVectorizer()
X_train_vec = vec.fit_transform(X_train)

# tune C / n_estimators on a validation split
model = LogisticRegression(C=c)
model.fit(X_train_vec, y_train)
y_val_pred = model.predict(X_val_vec)

# refit best model on full train, score on held-out test
print("Accuracy:", accuracy_score(y_test, y_test_pred))
NLP · Build

Voice Assistant Review Sentiment Classifier

SENTIMENT MODEL

A binary sentiment classifier on Amazon Alexa reviews that predicts whether a written review reflects positive or negative feedback. I compared Logistic Regression against a Random Forest, both over bag-of-words features, tuning each on a dedicated validation split before refitting the best configuration on the full training set and scoring on a held-out test set.

Built end-to-end in Python / scikit-learn: CountVectorizer features, a clean train/validation/test protocol, and accuracy / precision / recall reported on data the model never saw during tuning.

Tools & skills

Pythonscikit-learnpandasPlotlyModel Selection

What I learned

  • A held-out test set is sacred. Every tuning decision belongs to validation, never to the final score.
  • A well-regularized linear model makes a brutally strong baseline, so complexity has to earn its place.
  • Precision and recall, not accuracy, tell you what a sentiment model is really doing on the minority class.
07
Database · Optimization

IMDb Database & Query Optimization

AZURE SQL · QUERY OPTIMIZATION

A relational database built over the full public IMDb dataset on Azure SQL. I loaded the raw .tsv exports into a normalized schema (Title, Basics, Principals, Name) and shaped a query workload of real questions, like most-prolific actors, titles by keyword, and films per genre and year.

The heart of the project was performance: I benchmarked the workload, found the full-table scans, and tuned runtime with targeted SQL indexes, using covering indexes and composite keys chosen to match each query's join and filter pattern, then re-ran the workload to measure the improvement.

Tools & skills

SQLAzure SQLSchema DesignIndexingETLQuery Tuning

What I learned

  • An index is a bet on a query pattern. Composite keys like (startYear, tconst) only pay off when they match the workload.
  • You can't optimize what you haven't measured, so the benchmark came before every index.
  • Loading messy public data correctly is half the engineering. The schema is where data quality actually gets enforced.
SQL · WORKLOAD INDEX TUNING
-- targeted indexes for the query workload
CREATE INDEX onNConst ON Principals (nconst);
CREATE INDEX onTitle  ON Title (title);
CREATE INDEX onGenre  ON Basics (genres);
-- composite, covers filter + key lookup
CREATE INDEX onYear   ON Basics (startYear, tconst);
08
FIG · ENTITY-RELATIONSHIP DIAGRAM
Entity-relationship diagram for the King County Metro database: Rider, Route, Fare, Bus Operation, Buses, Bus Driver, Calendar
Database Design

King County Metro Database

RELATIONAL DESIGN

A relational database designed for King County Metro to address two real problems: accessibility (coverage in underserved areas) and efficiency (route performance and delays). I modeled the full domain (riders, routes, fares, bus operations, vehicles, drivers, and service calendars) into a normalized schema with a complete entity-relationship diagram and relational mapping.

The schema is the SQL foundation; on top of it I framed a Python (pandas) analysis layer for the information needs the system exists to serve: ridership demand by route, peak-time performance, and delay patterns. Those are the queries that turn the database into decisions.

Tools & skills

SQLPythonER ModelingNormalizationpandas

What I learned

  • Good ER modeling is really requirements analysis. Every entity traces back to a stated information need.
  • Normalization is a conversation about which facts are allowed to change independently.
  • A transit schema is also an accessibility statement. What you choose to model is what you can measure and fix later.
09
Architecture · Analysis

TensorFlow Architecture Analysis

DEVELOPMENT-VIEW STUDY

A development-view analysis of the TensorFlow codebase that maps how one of the largest open-source ML frameworks is actually organized, from the tf.* Python frontend that users touch, down through the C API, the C++ core runtime and kernels, the MLIR/XLA compiler stack, and TensorFlow Lite. The deliverable explains the layered dependency structure in plain language.

To keep the architecture map honest rather than hand-wavy, I used Python to walk the repository tree, measuring module sizes, mapping import dependencies between packages, and surfacing the real submodule boundaries (eager/, autograph/, grappler/, kernels/) that the write-up is built on.

Tools & skills

PythonRepo AnalysisSoftware ArchitectureTechnical Writing

What I learned

  • Layering is the whole trick. Each layer only depends downward, which is exactly what lets the core change without breaking the bindings.
  • The C API exists as a seam, one translation point so every language binding doesn't have to dig into C++ internals.
  • Reading a giant codebase is a data problem. Scripting the structure beats scrolling through it.
FIG · TENSORFLOW LAYER STACK
tensorflow/python/tf.* frontend · keras · autograph
tensorflow/c · cc/C API seam · language bindings
tensorflow/core/C++ runtime · kernels · graph
compiler/ · xla/MLIR · XLA · JIT
hardwareCPU · GPU · TPU · TF Lite
10
FIG · NEW CASES BY STATE · MAR–MAY 2020
Line chart of new COVID-19 cases per month by US state, March to May 2020, with policy-response markers
Analysis · Viz

COVID-19 Regional Analysis

TRENDS · IMPACT · RESPONSE

An analysis of COVID-19 trends, impact, and government responses across US states, tracking new cases over time against the timing of state-level policy responses and showing how differently regions moved through the early pandemic. New York's early spike against the slower curves of other states is the throughline.

I worked the data in Python (pandas), reshaping case and response series and aligning policy-response dates to the case timeline, then used SQL to aggregate cases by state and month before plotting. The chart annotates each state's response date directly onto the case trajectory.

Tools & skills

PythonSQLpandasMatplotlibTime-Series

What I learned

  • Lining events up against a time series is where the insight lives. The case curve only means something next to the response date.
  • Per-capita versus raw counts changes the story completely, so the framing is an analytical choice, not a neutral one.
  • One well-annotated chart can carry an argument better than a page of tables.

↳ MORE ON GITHUB · GITHUB.COM/SAM-MALIK